"Report confirms climate change is a fact.
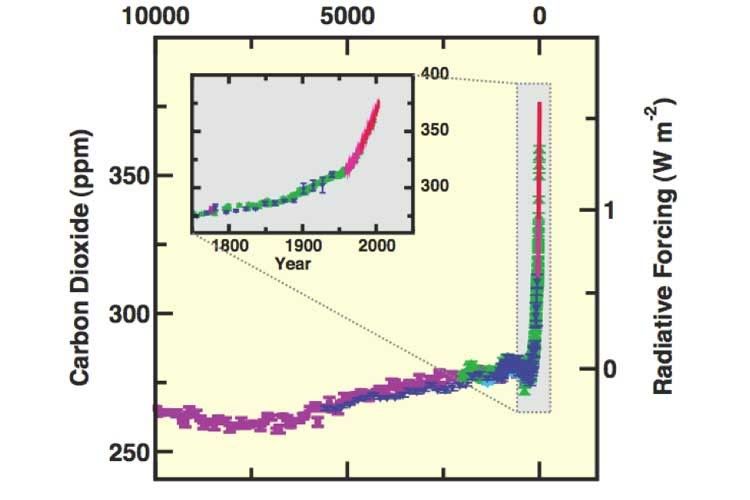 This graph shows the increase in the concentration of carbon dioxide in the earth's atmosphere over the last 10,000 years (panel inset shows the increase since 1750) based on the study of ice cores. Different colors represent different studies. Radiative forcing indicates the influence a factor has on the amount of energy entering or leaving the earth's atmosphere and is an index of how important the factor is as a climate change mechanism. The higher it is, the more important it is.
Der Spiegel reports:
The United Nations on Friday issued its most dramatic warning yet about the potentially catastrophic effects of climate change on the planet. European political leaders say we must cut greenhouse gas emissions and adapt to a climate change process that is already underway.
Climate change in the coming century may lead to disasters ranging from famine in Africa to the thinning of Himalayan glaciers, according to the long-awaited second part of an extensive United Nations report on global warming. More than 100 countries represented in the UN's panel on climate change spent a tense Thursday night in Brussels trying to agree unanimously on the language of a final draft.
The report, prepared by more than 2,500 scientists for the UN Intergovernmental Panel on Climate Change (IPCC), provides the first confirmation from the entire international scientific community that the burning of fossil fuels by humans is one of the main culprits of global warming.
Scientists "have finally established at the global level that there is an anthropogenic, there is a man made climate signal coming through on plants, animals, water and ice," said Martin Parry, co-chair of the IPCC working group the assembled report. "This is the first time this signal has been confirmed at the international level."
Desertification and water shortages
The report claims that global warming will lead to desertification, droughts and rising seas and that those living in the tropics will be the worst hit -- from sub-Saharan Africa to the Pacific islands. Billions could face water shortages, and ocean levels might rise for centuries to come. It could lead to a sharp drop in crop yields in Africa and bring heatwaves to Europe and North America. Europe's Alpine glaciers will disappear and much of the coral that comprises Australia's Great Barrier Reef will die from bleaching.
The scientific conclusions -- based on 29,000 sets of data -- also said that up to 30 percent of the Earth's species faced a higher risk of vanishing if global temperatures rise 2 degrees Celsius (3.6 degrees Fahrenheit) above the average in the 1980s and '90s.
"The urgency of this report prepared by the world's top scientists should be matched by an equally urgent response from governments," said Hans Verolme, director of the global climate change program at the conservation organization WWF. "Doing nothing is not an option."
Merkel to address issue at G-8 summit
The contents of the report, most of which had already been leaked to the media in recent weeks, prompted political leaders to call for action, including German Chancellor Angela Merkel. "The report confirms that climate change is a fact," Merkel told the Munich daily Süddeutsche Zeitung. "That's why we need quick and determined action to limit the rise in temperatures worldwide and reduce emissions of carbon dioxide. I will also address the issue at the G-8 summit. My aim is, insofar as possible, to involve all states in taking responsibility for climate protection. "
Merkel said she hoped recent European Union actions might help to push China and the United States -- the world's two largest sources of greenhouse gases -- to do more to reduce emissions. In March the EU's 27 member states agreed cut greenhouse gas emission by at least 20 percent from 1990 levels over the next 13 years. In addition, it agreed that at least one-fifth of all of the EU's energy would come from renewable sources by 2020.
Speaking on Friday, EU Commissioner for the Environment, Stavros Dimas warned that the report "further underlines both how urgent it is to reach global agreement on reducing greenhouse gas emissions and how important it is for us all to adapt to the climate change that is already under way."
"Scientific vandalism"
Originally, the report was to be released on Friday morning at 10 a.m., but the presentation was delayed for hours as heated discussions continued as countries like China, Russia and the US continued to lobby for the removal of parts of the report.
US delegates also opposed a passage warning of the prospects of "severe economic damage" to parts of North America. But the main tension in Brussels between some authors of the report and some political representatives was not over the scientific findings, but over a 21-page summary that would be shown to policymakers.
Earlier this week, the summary said scientists had "very high confidence" that natural systems around the world "are being affected by regional climate changes, particularly temperature increases."
"Very high confidence," in the language used by the report, translates to a 90 percent certainty. Delegates from China and Saudi Arabia lobbied for "high confidence" instead, or 80 percent certainty -- and after a dramatic hours-long protest by three scientists on Thursday night, the milder language went in.
"The authors lost," said one of the scientists. "A lot of authors are not going to engage in the IPCC (International Panel on Climate Change) process anymore. I have had it with them," he told the Associated Press on condition of anonymity.
Though Washington and Beijing ultimately succeeded in changing very little of the text, the political tug o' war drew sharp criticism in Germany. "We are happy that we were able to prevent this kind of scientific vandalism in the end," Environment Minister Sigmar Gabriel told Reuters TV. "The people have a right to find out about the consequences that threaten them if we are unable to stop climate change."
Still, the final version is the clearest and most comprehensive scientific statement to date on the impact of global warming. "Certain passages were lost for time or for lack of agreement," Parry said, "But I don't think in any respect that the message was lost."
In the first part of the study -- released in February in Paris -- the IPCC concluded with 90 percent certainty that humans were the main cause of global warming since 1950. That alone was an unprecedented statement by a global body; but this section of the report details how species, water supplies, ice sheets and regional climate conditions were already being affected.
Friday's report was the second of four to be released by the IPCC this year. The findings of those reports are expected to serve as a guide for negotiations over extending the Kyoto Protocol, the main UN plan for capping greenhouse gas emissions beyond 2012.
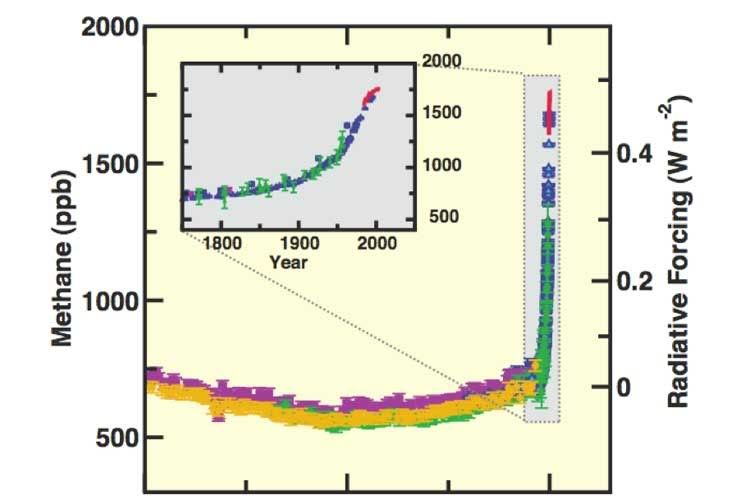 This graph shows the increase in the concentration of methane in the earth's atmosphere over the last 10,000 years (panel inset shows the increase since 1750) based on the study of ice cores. Different colors represent different studies. Radiative forcing indicates the influence a factor has on the amount of energy entering or leaving the earth's atmosphere and is an index of how important the factor is as a climate change mechanism. The higher it is, the more important it is.
This graph shows the increase in the concentration of nitrous oxide in the earth's atmosphere over the last 10,000 years (panel inset shows the increase since 1750) based on the study of ice cores. Different colors represent different studies. Radiative forcing indicates the influence a factor has on the amount of energy entering or leaving the earth's atmosphere and is an index of how important the factor is as a climate change mechanism. The higher it is, the more important it is.
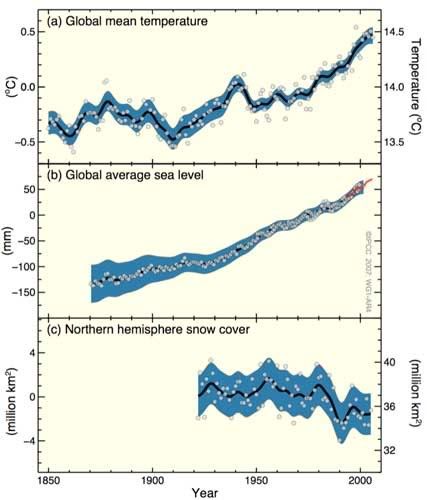 Changes in a) global average surface temperature; b) global average sea level rise; and c) snow coverage in the Northern Hemisphere from March to April. All changes are relative to corresponding averages for the period 1961 to 1990. Smoothed curves represent decadal averaged values while circles show yearly values.
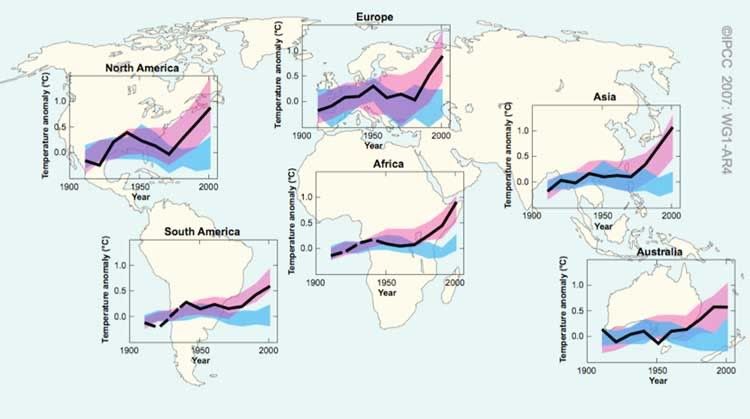 A comparison of continental and global surface temperature rises. The black lines show decade-by-decade rises relative to the average from 1901 to 1950. The blue lines shows natural forces contributing to global warming. The pink lines show natural forces combined with human activity.
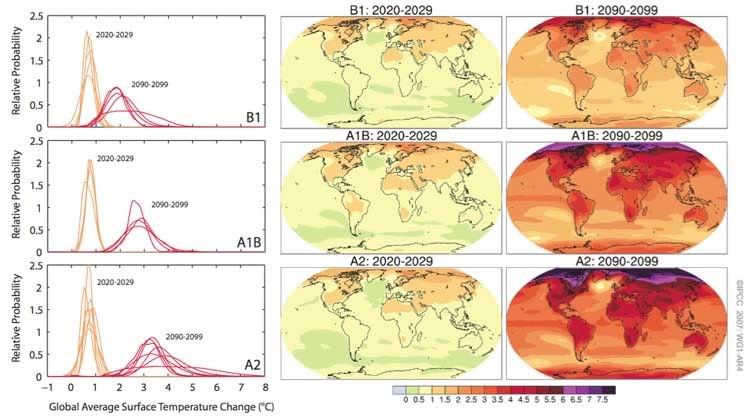 What next? The middle column shows projections for temperature increases based on three separate models. The middle column shows 2020-2029 and the right hand column shows 2090 to 2099. The color-coded scale corresponds to Celsius degree rises. The three scenarios B1, A1B and A2 are based on different assumptions about economic growth, population development and fuel usage.
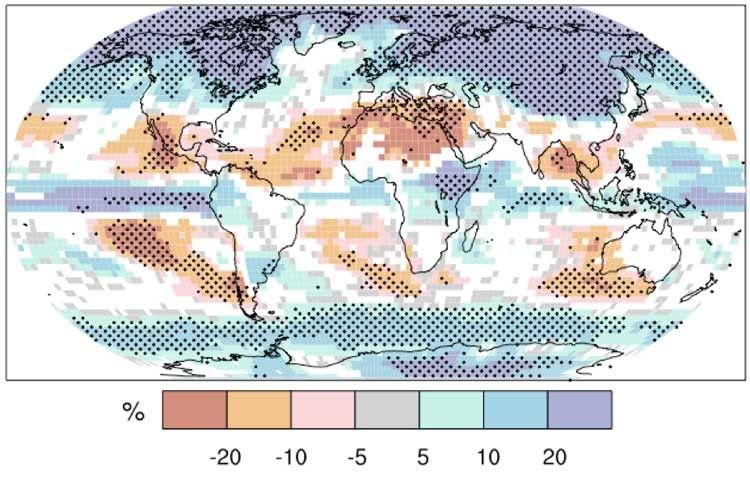 This graph shows expected relative changes in winter precipitation (in percent) for the period 2090 to 2099 relative to the period 1980 to 1999 using the A1B model. White areas show where less than 66 percent of the models agree on the change. Dotted areas show where more than 90 percent of the models agree.
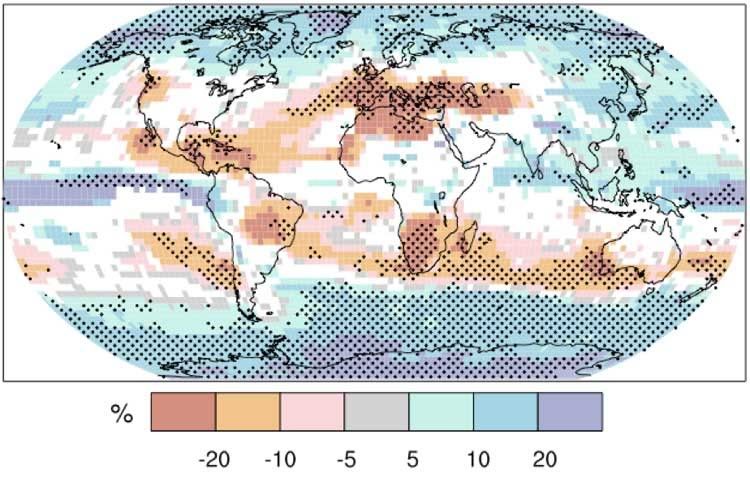 This graph shows expected relative changes in summer precipitation (in percent) for the period 2090 to 2099 relative to the period 1980 to 1999 using the A1B model. White areas show where less than 66 percent of the models agree on the change. Dotted areas show where more than 90 percent of the models agree.
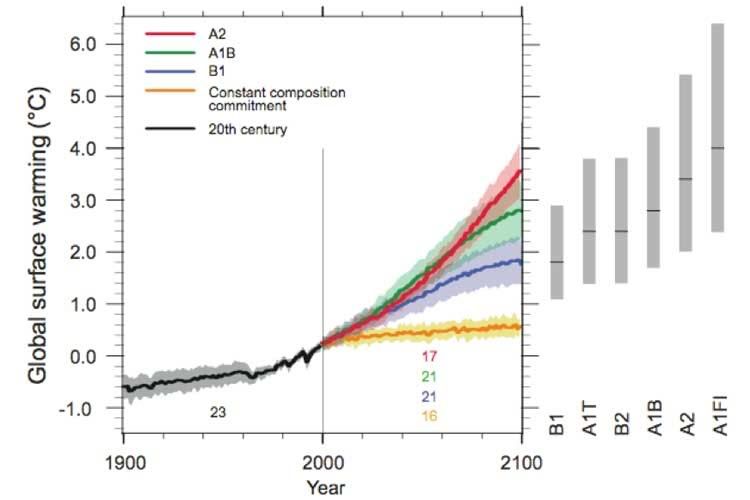 How hot is it going to get? The black line at the left shows the 20th century. The colored solid lines show where the temperature might go using different models -- shading indicates error ranges. Bars at the right show best estimates (solid lines) with the gray showing the likely range.